
On Trading with The Elliott Wave – The Basics IV, we will explain the basic features of corrections and the correct way to trade them
Trading corrections
Market movements against the primary trend are fights between those who think that the trend is over and those that see a pullback as an opportunity to jump into the still prevailing trend. This struggle makes corrective patterns a dangerous and unproductive place. My advice to inexperienced traders is not to trade corrections until getting deep knowledge about how a particular market behaves. This market phase is like to a river crowded with thousands of crocodiles. You may be lucky and cross the river, but you’re risking losing one leg or both.
A corrective phase is more complex than an impulsive phase; it unfolds slowly and depicts a noisy, random, path, taking diverse shapes such as flats, triangles zigzags or a combination. They are erratic, time-consuming, and misleading.
There are situations where the channel within which the corrective wave moves is wide enough so that the potential reward is high enough. Under those circumstances, it may be beneficial to move to a shorter timeframe to detect the right entry points.
Corrective processes show two classes. Sharp corrections and sideways channels. No more explanation needed. Sharp corrections move prices to correct a substantial part of the movement of the main trend. Sideways channels depict lateral movement that, while moving prices away from the previous trend ending, it contains legs that carries price back to, or even beyond its initial level producing a kind of lateral channel.
There are three main categories: Zigzags, Flats and Triangles.
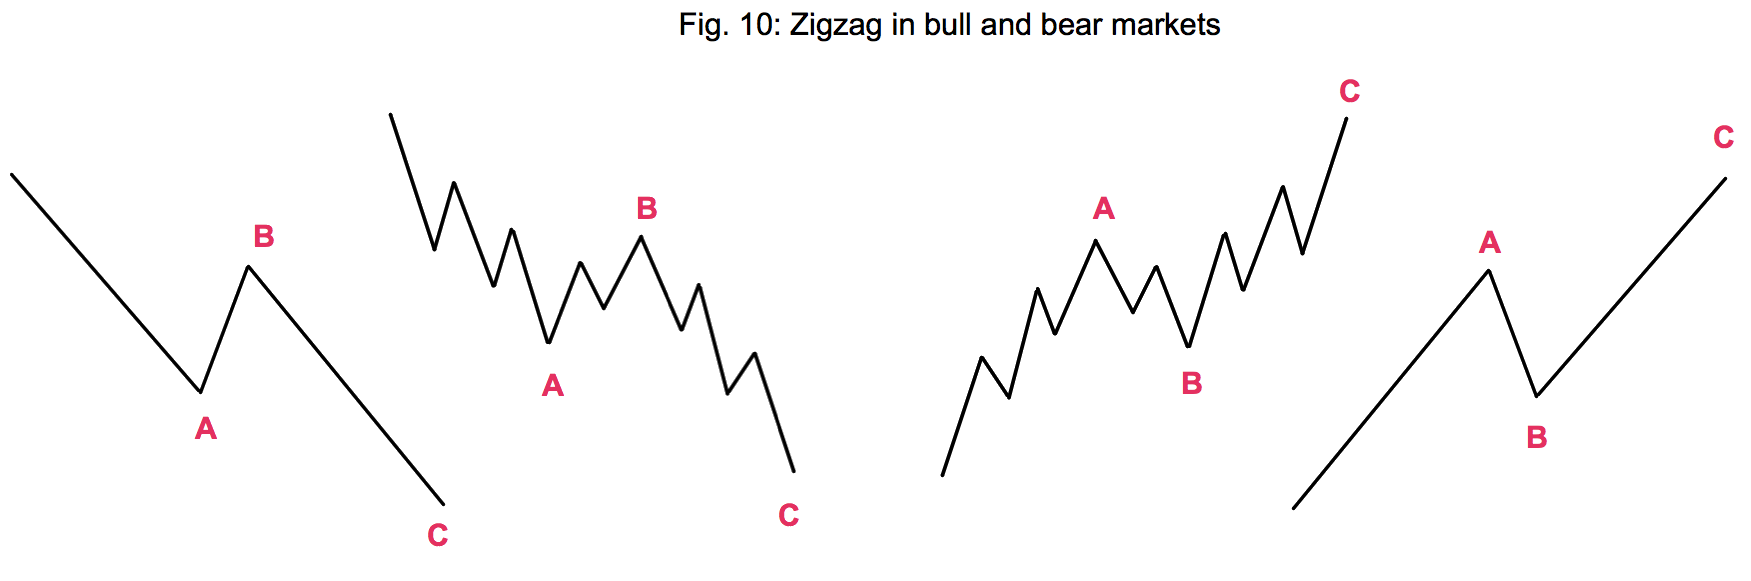
ZigZags
A single zig-zag in a bull market is a simple three-wave (A-B-C) pattern that pulls back some of the gains of the primary trend (fig. 10, left side). In bear markets, corrections are a kind of bear traps that drive prices up in the opposite way (fig 10, right side).
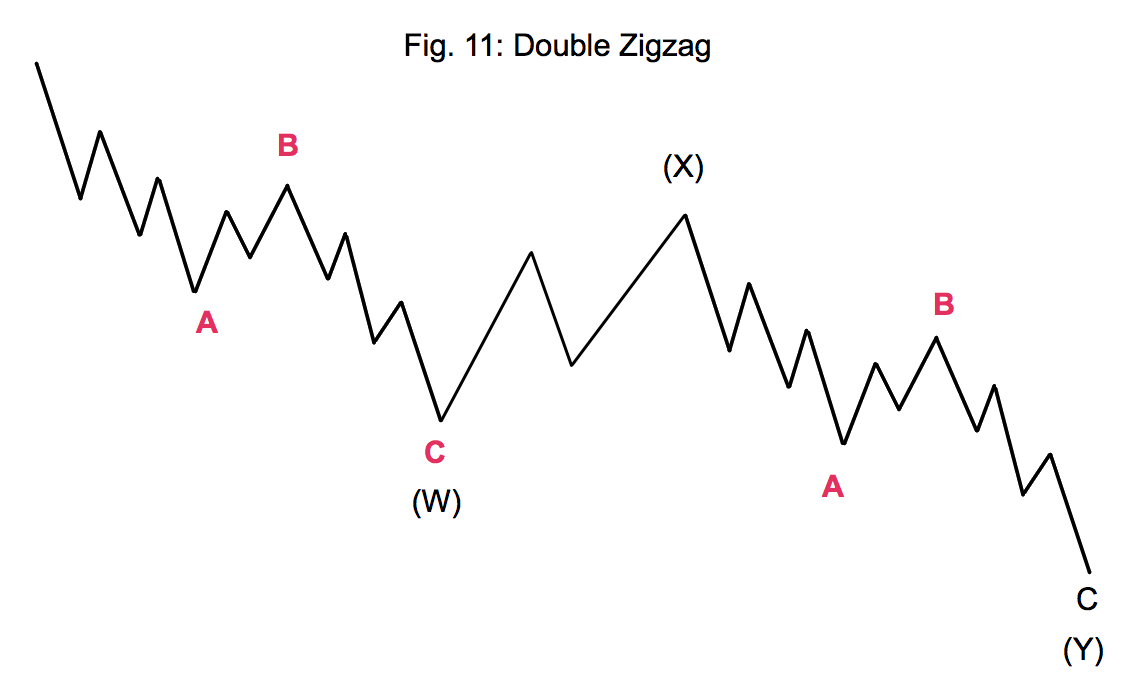
On occasions, double or triple zigzags occurs. In that case, according to Frost and Prechter, zigzags are separated by an intervening “three”. These formations, still, according to Frost and Prechter, are analogous to the extension of an impulse wave but are less common.
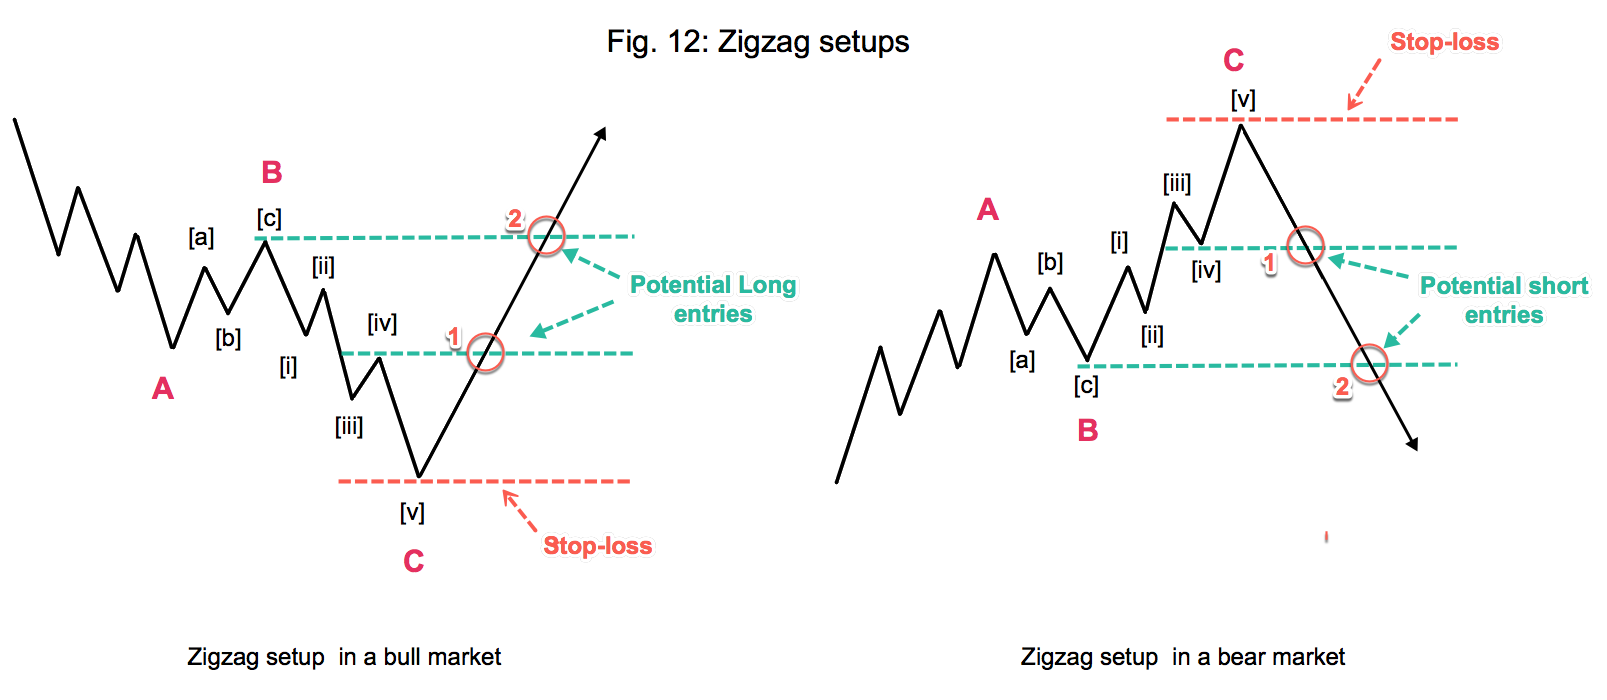
Zigzag setups for bull and bear markets are shown in Fig. 12. These setups profit from taking a c-wave. Also, assume this is the end of the correction and that a new wave in the direction of the main trend is starting. Therefore, we have three ways to trade it, as happened in ending diagonals. The more aggressive style, presenting the best reward for its risk, is taking the trade at point (1) of fig 12. That corresponds to the breakout of the [iv] sub-wave. A more conservative approach is to wait for the breakout of the [c] wave. On this case, it corresponds to the extreme of wave B (Fig. 12, point (2)). Finally, we could take a medium-risk approach by opening with a fraction of the total risk at (1) and take the rest at (2).
The next article will deal with flats and triangles.
Take your trading to the next level with our 14 Day, No Obligation, Free Trial. You will soon discover why we are trading’s best-kept secret. We are successfully building the world’s largest group of profitable traders and would like you to be part of it.
You can join for as little as $19.99 per month, no contract, cancel anytime. Just one profitable trade each month covers this amount, the rest is pure profit. You will benefit from unparalleled access to our professional traders, our transparent trading performance, our LiveTradeRooms and access to the most comprehensive trading education on the market. What have you got to lose? JUST CLICK HERE TO GET STARTED NOW and see how real money is made!
