Trading with The Elliott Wave – The Basics

The basics of the Elliott Wave Principle

 
The basis of the Elliot wave analysis is this. The market moves in a fractal pattern of waves. Its basic model is formed by a pair of waves: An impulsive wave and a corrective wave. Finally, the end of the correction marks the beginning of another impulsive wave.Trading with The Elliott Wave - The Basics
 
Within this idealized Elliott world, the impulsive phase is a pattern of five waves. Three of them of impulsive nature and two corrective.
Trading with The Elliott Wave - The Basics
 
The corrective wave pattern is a mixture of 3 waves, two impulsive and one corrective, which elliotticians identify using letters.
Trading with The Elliott Wave - The Basics
 
N. R. Elliott observed the price action form larger and smaller versions of the main wave pattern. This repetition means that price behaves in a fractal manner. By keeping the wave count, traders can identify how old the current trend is and the likely place of a new beginning.
Trading with The Elliott Wave - The Basics
 

Points about Elliott Wave Analysis that helps in trading:

 
1. Identifying the main trend direction
 
2. Visualizing counter-trend legs
 
3. Determining the trend maturity.
 
4. Defining potential targets
 
5. Specific invalidation points
 
6. The most profitable waves to Trade
 

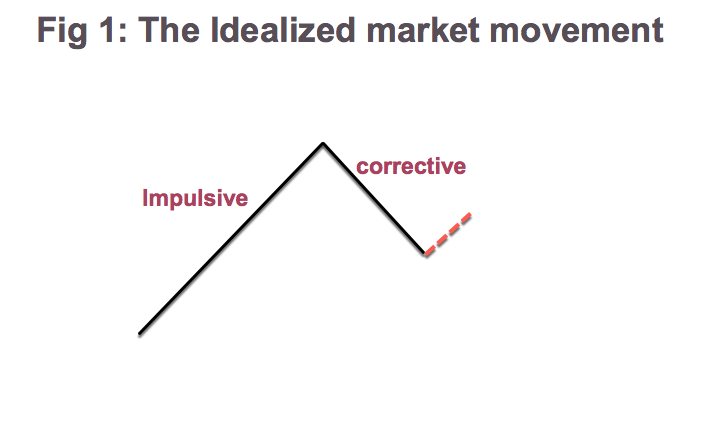
Identifying the main trend and why is it important

 
Impulsive waves are the easiest to trade. It’s the path of less resistance, and where reward to risk is the highest. Corrective segments are difficult to trade. They depict a lot of volatility and noise, because it’s a place where bulls and bears fight to take control of the price. Fig. 5 shows a risk to reward study on both waves. We observe that corrective waves are noisy, with limited rewards for the risk. Impulsive waves are exuberant and optimist, price segments where we can optimize reward. Therefore, it’s wise to trade with the trend.
 
The identification of the primary trend is quite straightforward. It’s the direction pointed by one or several previous impulsive legs, in the case of Fig. 5 it’s obvious we are at an uptrend.
Trading with The Elliott Wave - The Basics

Visualization of countertrend legs

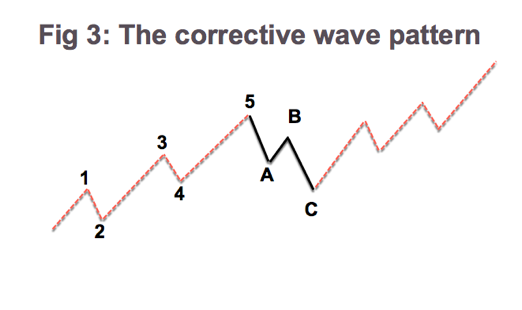
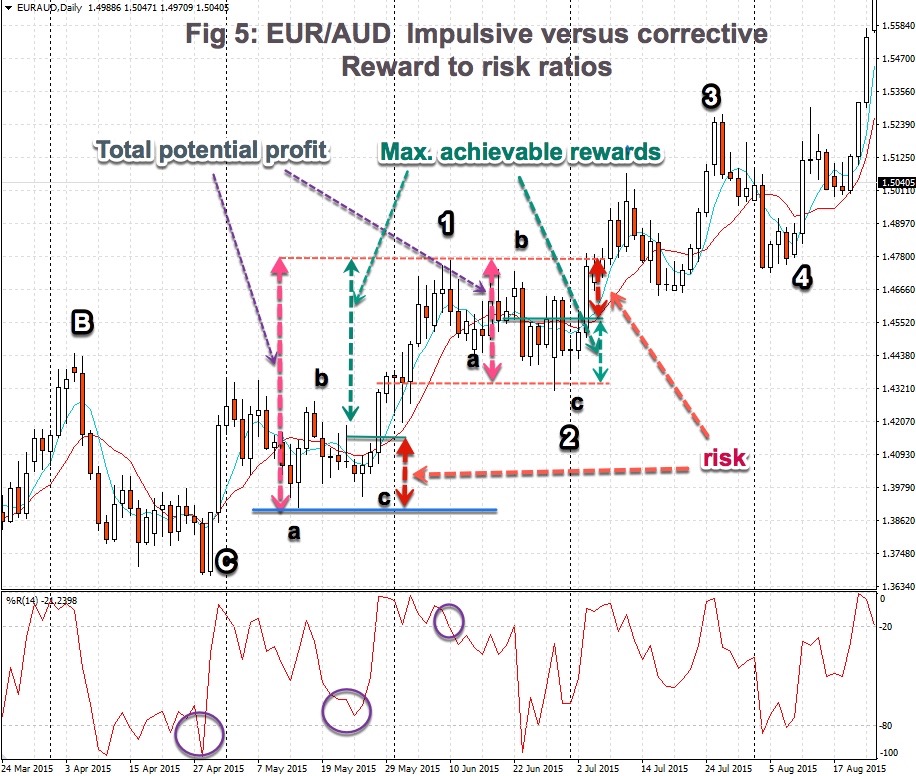
Corrective segments are places of recess from the impulsive phase. The impulse has traveled too far, according to participants, and some of them take profits, while others sell short.

But, corrective waves are continuation patterns. Therefore, a C-wave edge identifies a place of low risk and high reward to start trades aligned with the primary trend. Examples of what I mean is the end of c waves in fig 5 that signs the beginning of a new and tradable impulsive pattern in the main trend direction.

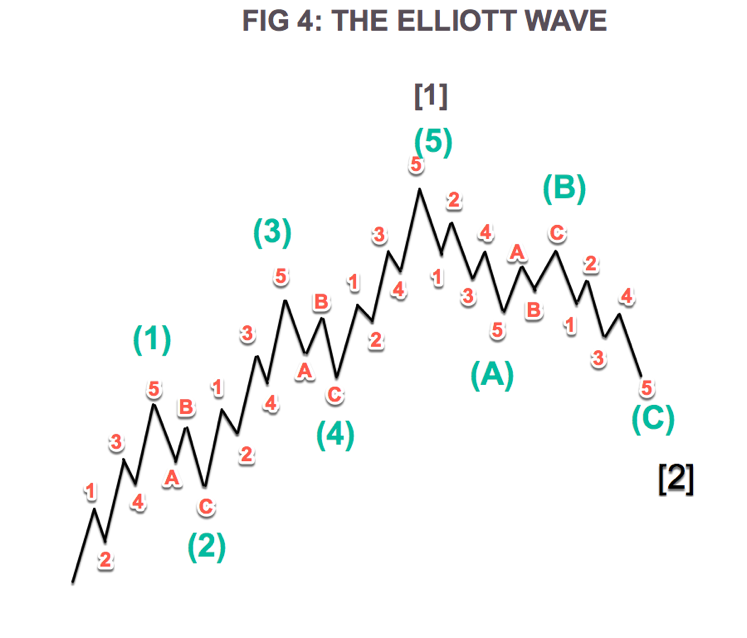
Trend maturity determination

As we observe in Fig 4, Market waves form wave patterns within wave patterns in a continuous fractal fashion. We see that wave [1] subdivides into five small waves. Therefore, we can identify the maturity of prices by looking at where they are on the wave map.

On the next article, we will discuss target definition, invalidation points, and the most profitable waves to trade.


Take your trading to the next level with our 14 Day, No Obligation, Free Trial. You will soon discover why we are trading’s best-kept secret. We are successfully building the world’s largest group of profitable traders and would like you to be part of it.

You can join for as little as $19.99 per month, no contract, cancel anytime.  Just one profitable trade each month covers this amount, the rest is pure profit. You will benefit from unparalleled access to our professional traders, our transparent trading performance, our LiveTradeRooms and access to the most comprehensive trading education on the market. What have you got to lose? JUST CLICK HERE TO GET STARTED NOW and see how real money is made!

Trading with The Elliott Wave - The Basics