
In Market types and the tools of the Trade, we will analyse the market anatomy.
Introduction
On their pursuit for a profitable system or strategy, traders look at past behaviours as a forward indicator of prices.
Indeed, if price movement is an objective manifestation of the average trader sentiment, then wherever in the future the same sentiment arises, a pattern might take place with a shape similar to the one drawn in the past. From this belief, it follows that the study of patterns may be of help to find entry and exit points in our pursuit of profits.
There is a catch, though. The human brain is a natural pattern recognizing system. We see patterns everywhere. In normal life that’s the way we recognize things: A round tire, a rectangular table or a staircase shape. When random events enter into the equation, we continue seeing patterns, although not always they may exist. Nowadays, Technical Analysis is evolving toward a more evidence-based framework, pushed by authors such as David Aronson, Robert Carver, and others.
I’ll deal with this framework in a future article series; but, throughout the following issues, we’ll deal with the standard TA framework as a foundation for the later. We will develop a base knowledge and the tools to trade the three different market types.
Please keep in mind that, here, we’re dealing with uncertain events, so nothing is 100% sure. Sometimes not even 50% sure. But our objective when trading isn’t being right, but profitable, so as long as our overall performance is positive, the technical signal is good.
Market classification
There are three basic market types:
- Bull markets: extended ascending trends with sporadic retracements or sideways moves or channels.
- Bear markets: extended, descending trends with sideways movements or deep and fast bear-trap retracements.
- sideways markets: Moving on a relatively wide horizontal channel.
Of course, when trading currency pairs, a bearish market in one pair is a bullish market in its inverse pair, so the tools for bear and bull markets tend to be somewhat similar, and the situations encountered quite symmetric.
Sometimes, lateral markets aren’t perfectly horizontal. The main feature of a lateral market is its increased volatility and noise. The other trait is the seemingly cyclic nature of their movements.
Anatomy of a trend
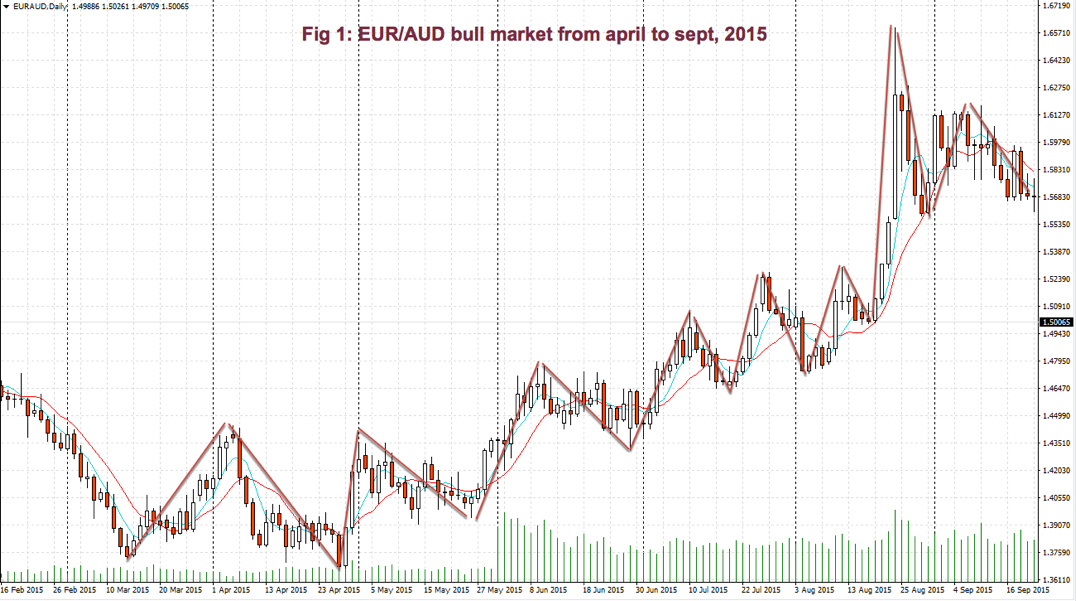
In Fig 1we may observe a bullish trend on the EUR/AUD, back in 2015. We may find that prices move in waves. However, the crest of a new wave goes higher than its preceding one. Similarly, its valley is higher than preceding valleys, as well.
So, a practical definition of an uptrend is a price pattern with higher highs and higher lows. Consequently, a bearish trend, or downtrend, is, then, a price pattern with lower highs and lower lows.
Trends happen on any time-frame. Even a single bar might be classified as bull, bear or lateral. A candlestick with a long white body and short shadows is, in fact, a bullish trend in its own tiny time-frame. Whilst, a long black candle with small shadows account as a bearish trend.
Lateral movements on a single bar happen when the candle presents a small body, or none at all, together with long upper and/or lower shadows.
Phases on a bullish trend:
The wavelike pattern, present in most trends, is the result of phases of accumulation, distribution, and sale that draw two different kinds of patterns: One impulsive and one corrective. Every one of these phases accounts as a trend (or lateral channel) in a shorter time frame, which might be composed, at the same time, by shorter trends with its own phases of accumulation, distribution, and selling.
Accumulation phase:
In the later stages of a wave valley, there is accumulation by smart traders who think there is a good opportunity with low risk, forming a support level. Sometimes, this support is briefly broken to the downside, stops are taken and, then, the price back up, again, above support.
After this last trick to fool the weak hands, price starts to climb, slowly at first, faster as momentum grows. In the final moments of this phase, price moves fast, with large price increases on higher volume.
Distribution phase:
In the final stage of an impulsive phase, selling begins by smart profit takers, while the price is still rising, then it reaches overbought levels. A kind of barrier seems to have been established: It’s called a resistance level.
At those levels, more traders are willing to sell than buyers can manage, so price stagnates. Latest bulls don’t have the strength to raise prices beyond that point, but this new leg high is higher than the one on the previous impulsive phase.
Selling phase:
Price moves in a declining channel. Traders that went long at its highs close at a loss. Thus, the price moves down. Then, price recovers as if a new leg up might happen, just to fade again a bit lower than before. Several push-pull phases take place, its pattern like a fading oscillation.
Price reached new support, and a new accumulation phase begins. Usually, this support is at or near the high of the previous impulse high. This phase draws a corrective pattern.
Take your trading to the next level with our 14 Day, No Obligation, Free Trial. You will soon discover why we are trading’s best-kept secret. We are successfully building the world’s largest group of profitable traders and would like you to be part of it.
You can join for as little as $19.99 per month, no contract, cancel anytime. Just one profitable trade month covers this amount, the rest is pure profit. You will benefit from unparalleled access to our professional traders, our transparent trading performance, our LiveTradeRooms and access to the most comprehensive trading education on the market. What have you got to lose? JUST CLICK HERE TO GET STARTED NOW and see how real money is made!
