
Detecting trends – Trend Lines discusses trend lines, the proper way to draw them and how they help to assess the direction of the trend.
Introduction
On past articles, we’ve set the foundations of market classification, defined what a trend is about, and dissected a trend in its component phases. Then we talked about its structure: an impulsive wave, followed by a corrective wave. We dealt with support, resistance and breakouts. Finally, we talked about channel contractions.
So now, we’ll learn the methods available to the early discovery of trends: Trendlines, moving averages and Bollinger band channels.
Trendlines
A trendline is a line drawn touching two or more lows or highs of a bar or candlestick chart. The convention is to draw the line touching the lows on uptrends and the highs on downtrends. Sometimes both are drawn to form a channel where the majority of prices fit.
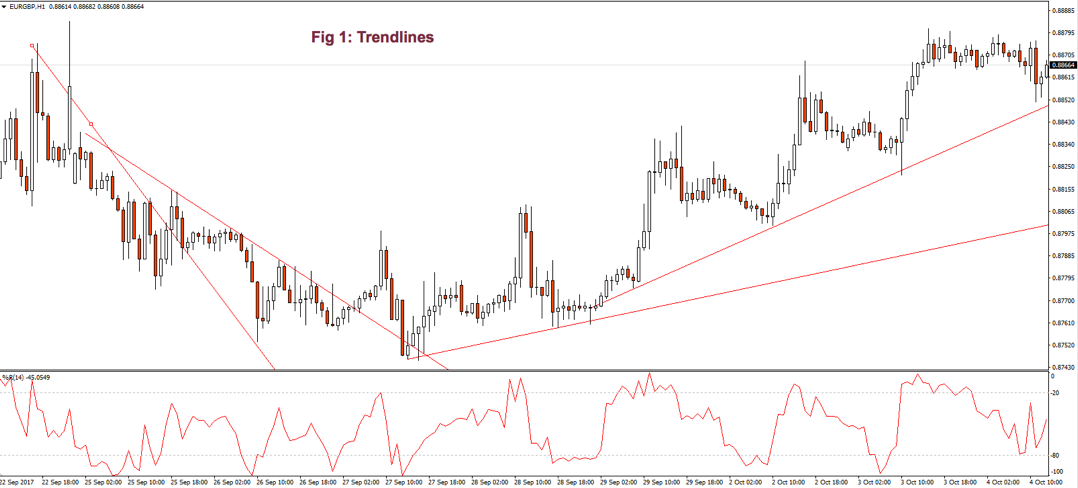
On Figure 1 we can notice that the trend line shows resistance levels. These are support zones where the price find it difficult to move further. Thererfore, bouncing from there, although not always. There we see that the first trendline has been crossed over by the price and during the following bars the slope of the down trend diminished. We notice, then, that the first trendline switched its role and now is acting as price support.
When the second trendline crossed over by the price, a bottom has been created, and a new uptrend started. After trending up for a while, you should note that a second trend line is needed to more accurately follow the new bottoms. That is because the trend has sped up and the first trend line is no longer able to track its bottom prices.
Trend channels
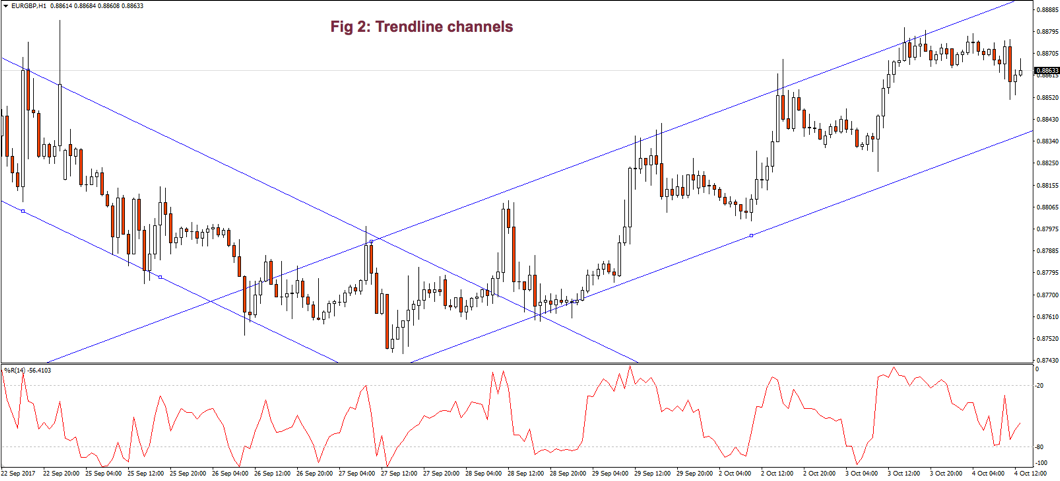
Fig. 2 shows two channels made of trendlines, one descending and the other one ascending. A trend channel allows us to watch the volatility of the trend and the potential profit within the channel.
The trend, as is depicted, has been drawn after the trend has developed for a long lapse. So, it’s been drawn after the fact. If we look at the descending channel, we observe that during the middle of the trend the upper trendline doesn’t touch the price highs. Thus, this channel would look different at an early stage of the chart.
I find more reliable the use of horizontal lines at support/resistance levels, and spot breakouts/breakdowns at the end of a corrective wave. A trend channel, though, might help us assess profitability and set targets to our trades ( such as the second leg on fig 2).
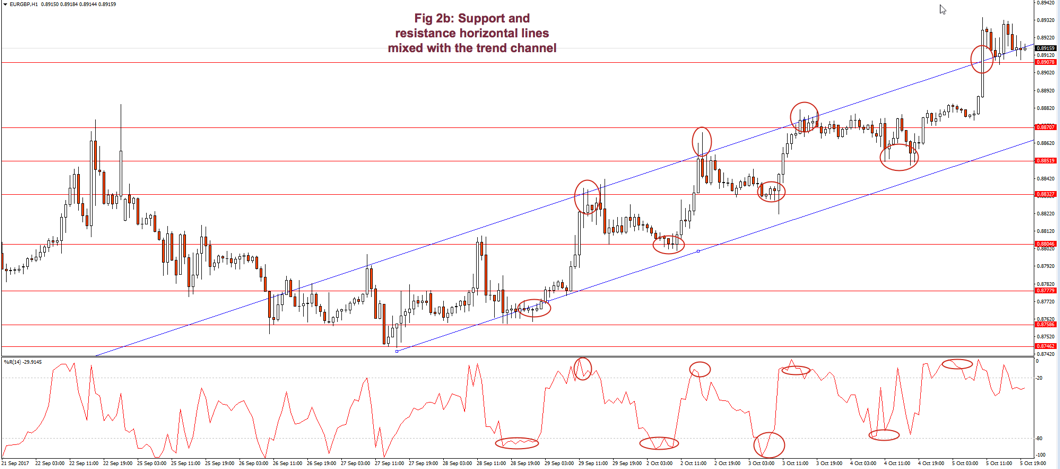
If we use horizontal trendlines together with a trend channel (see Fig 2.b) it’s possible to better visualize profitable entry points and targets. That allows, then, to easily compute reward to risk ratios. The use of Williams %R indicator (bottom graph) confirms entry and exit points.
Fig. 2b graph’s horizontal red lines show how resistance becomes the support in the next leg of a trend.
Summarizing
- A trendline heads in the direction of the trend and acts as a support or as resistance, depending on the trend direction.
- If a second trendline is needed we should pay attention if it shows acceleration or deceleration of the price movement.
- If the price crosses over or crosses under the trendline it may show a bottom or a top, and a trend change.
- A trendline channel helps us assess the potential profitability and assign proper targets to our next trade.
Join us
Take your trading to the next level with our 14 Day, No Obligation, Free Trial. You will soon discover why we are trading’s best-kept secret. We are successfully building the world’s largest group of profitable traders and would like you to be part of it.
You can join for as little as $19.99 per month, no contract, cancel anytime. Just one profitable trade each month covers this amount, the rest is pure profit. You will benefit from unparalleled access to our professional traders, our transparent trading performance, our LiveTradeRooms and access to the most comprehensive trading education on the market. What have you got to lose? JUST CLICK HERE TO GET STARTED NOW and see how real money is made!

Featured image courtesy of https://pxhere.com