
Moving Averages (MA)
Some centuries back, Karl Friedrich Gauss demonstrated that an average is the best estimator of random series.
Moving averages are used to smooth the price action. It acts as a low-pass filter, removing most of the fast changes in price, considered as noise. How smooth this pass filter behaves, is defined by its period. A moving average of 3 periods smoothens just 3 periods, while a 200-period moving average smoothens over the last 200 price values.
Usually, a Moving Average is calculated using the close of every bar, but there can be computed using any other of the price points of a bar, or a weighted average of all price points.
Moving averages are computationally friendly, thus, it’s easier to build a computerized algorithm using moving average crossovers than using trendlines.
The Most Popular types of Moving Averages
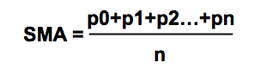
Simple Moving Average (SMA):
The simple moving average is computed as the sum of all prices on the period and divided by the period.
The main issue with the SMA is its sudden change in value if an important price movement is dropped off, especially if a short period has been chosen.
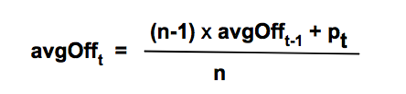
Average-modified method (AvgOff)
To void the drop-off problem of the SMA, the computation of an avgOff MA is made using and average-modified method:
Weighted moving average
The weighted moving average adds a different weight to every price point in the period of calculation before performing the summation. If all weights are 1, then we get the Simple Moving Average.
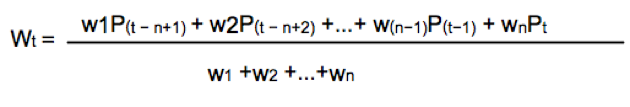
Since we divide by the sum of weights, they don’t need to add up to 1.
A usual form of weight distribution is such that recent prices receive more weight than former prices, so, price importance is reduced as it becomes old.
w1< w2< w3… < wn
Weights may take any form, most popular being Triangular and exponential weighting.
To implement triangular weighting on a window of n periods the weights increase linearly from 1 the middle element (n/2), then decrease to the last element n.
Exponential weighting is an easy implementation:
EMAt= EMAt-1 +a x(pt –Et-1)
Where a, the smoothing constant, is in the interval 0< a < 1
The smoothing property comes at a price: MA’s lags price, the longer the period the higher the lag of the average. The use of weighting factors helps reducing it. That’s the reason traders prefer exponential and weighted moving averages: Reducing the lag of the average is thought to improve the edge of entries and exits.
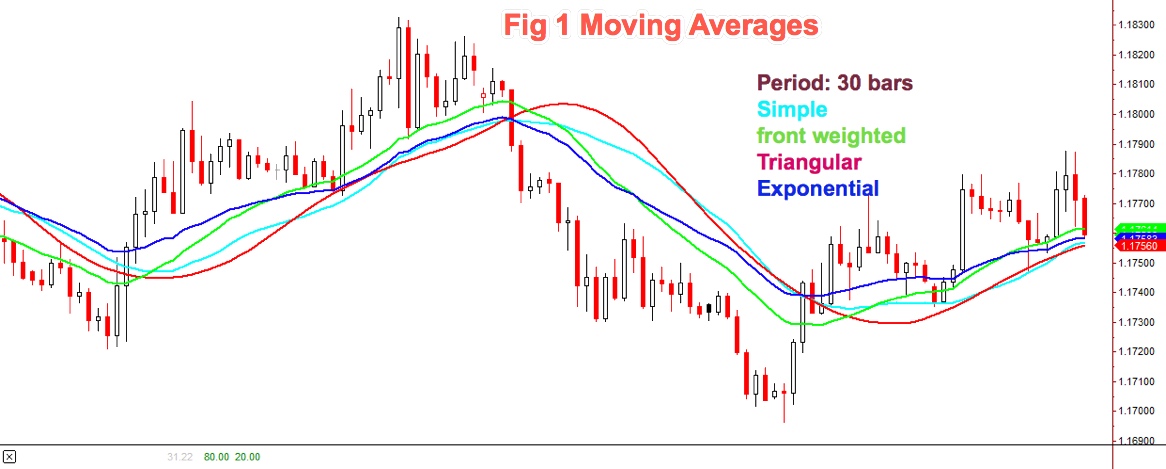
Moving Average Flavours
Fig 1 shows how the different flavours of a 30-period MA behave on a chart. We may observe that the front-weighted MA is the one with a slope very close to prices, Exponential MA is faster following price, but Triangular MA is the one with less fake price crosses, along with simple MA: The catch is: We need to test which fits better in our strategy. The experience tells that sometimes the simpler the better.
Methods to Detect Trends using MA’s
Detecting the trend using a moving average is simple. We select the average period to be about half the period of the market cycle. Usually, a 30 day/bar MA is adequate for short term swings.
MA Crossovers
One method to decide the trend direction is to consider it a bull leg if the bar close is above the moving average; and a bear leg if the close is below the average.
MA Slopes
Another method is to watch the slope of the moving average as if it were a trendline. If it bends up then it’s a bull trend, and if it turns down it’s a bear trend.
Dual MA
A third method is to use two moving averages: Fast-Slow (Fast -> smaller period).
In this case, there are two variations:
- Moving average crossovers
- All the averages pointing in the same direction.
As with the case of a single MA, a price retracement that touches the slower average is an opportunity to add to the position.
For example, using a 30-10 MA crossover: If the fast MA crosses over the slow MA we consider it bullish; if it crosses under bearish.
Using the method of both MA’s pointing in the same direction we avoid false signals when the fast MA crosses the slow one, but the slow MA keeps pointing up.
When using MA crossovers, we are forbidden to take short trades if the fast MA is above the slow MA, but we’re allowed to add to the position at price pullbacks. Likewise, we’re not allowed to trade on the buy side if the fast MA is below the slow MA.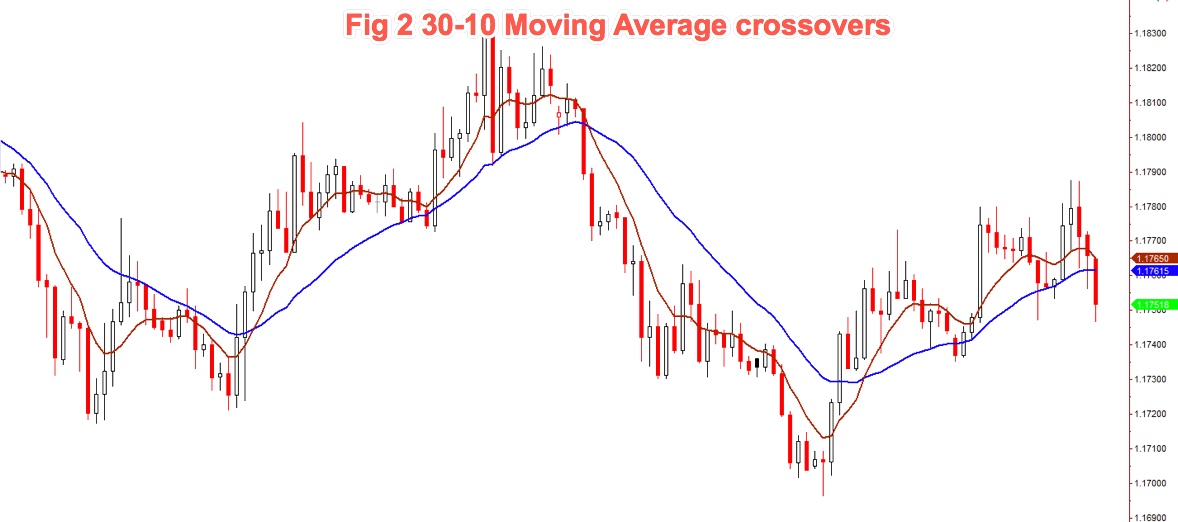
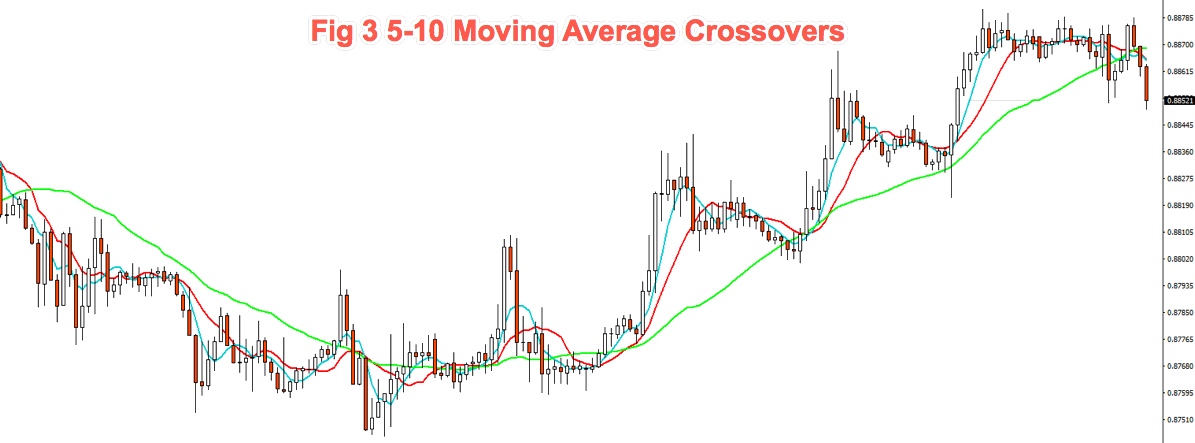
Using smaller periods, for instance, 5-10 MA, it’s possible to enter and exit the impulsive legs of a trend. Then, the 10-30MA crossovers are used to allow just one type of trade, depending on the trend direction, and the 5-10 MA crossover is actually used as signal entry and exit (if we don’t use targets). In bull trends, for example, we may enter with the 5MA crossing over the 10MA and we exit when it crosses under.
We have to warn the novice trader that the use of moving average crossovers as a trading method should be used with another filter to make sure a trend is in place and not a sideways meandering since on sideways price movements this method is a loser.
Join us
Take your trading to the next level with our 14 Day, No Obligation, Free Trial. You will soon discover why we are trading’s best-kept secret. We are successfully building the world’s largest group of profitable traders and would like you to be part of it.
You can join for as little as $19.99 per month, no contract, cancel anytime. Just one profitable trade each month covers this amount, the rest is pure profit. You will benefit from unparalleled access to our professional traders, our transparent trading performance, our LiveTradeRooms and access to the most comprehensive trading education on the market. What have you got to lose? JUST CLICK HERE TO GET STARTED NOW and see how real money is made!

Featured image courtesy of https://pxhere.com