
We already touched channels made by two trendlines as a mean to assess the current trend. There are other computationally friendly channel types that allow early trend detection and trading. One of my favourites is the Bollinger Band channel.
The Standard Bollinger Band
A Bollinger Band is a volatility channel and was developed by John Bollinger, who popularized the 20-period, 2 standard deviations (stdev) band.
This standard Bollinger band has a centre line that is a simple 20-period moving average. Based on this curve an upper band is drawn which is 2 standard deviations from the mean, and, also, a lower band that’s 2 standard deviations below it.
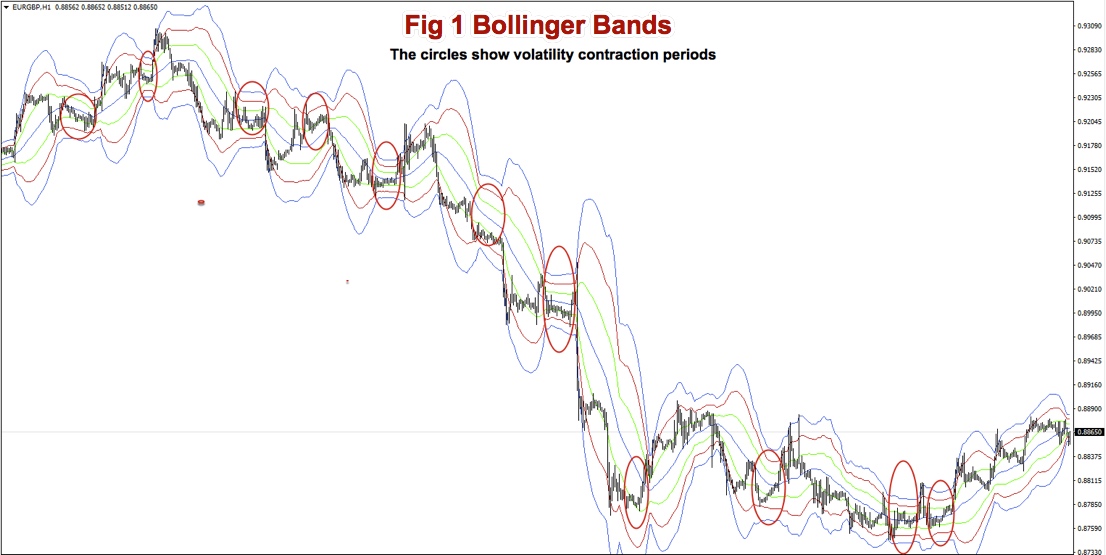
I use up to three 20-period Bollinger bands. The first band is one standard deviation wide, the second one is two standard deviations apart from the mean. A third band using three standard deviations may be, also, useful, so I draw it as well.
Fig 1 shows a very contracted chart with 3 Bollinger bands to better reveal how it shifts from high to low volatility periods. In fact, we can clearly detect that the periods of low and high volatility follow each other. We see also that the low volatility periods corresponds with sideways movement, therefore non-trending, and so, not too profitable to trade.
Price action in relation to the Bollinger lines
We can observe that bull trends move above the mean of the Bollinger band, usually above the +1 Bollinger line. During bear markets price moves below the mean of the bands and commonly below the -1 Bollinger line as well.
On impulsive legs of a trend, the price goes above 1-stdev (or below on downtrends) and it continues moving until it crosses the 2-stdev band, some times it even crosses the third 3-stdev band. Price beyond 2 stdevs is a clear sign of overbought or oversold.
On corrective legs, the price goes back to the mean. During those phases volatility contracts, and is an excellent place to enter at breakouts or breakdowns of the trading range.
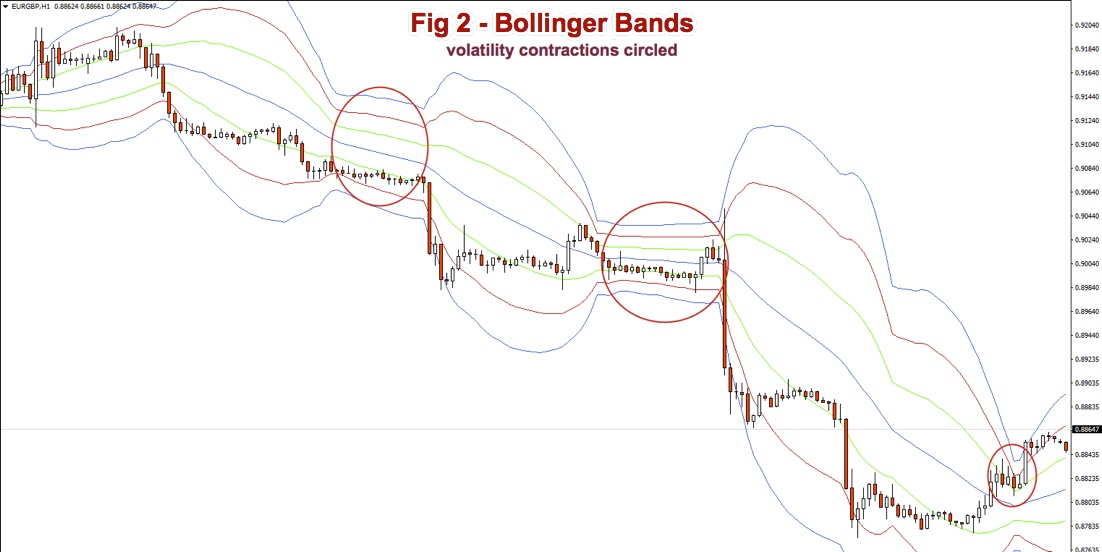
Below Fig. 2 shows an amplified segment of Fig 6, with volatility contractions circled. We may observe, also, how price moves to the mean, after crossing the 2 and 3 std lines. We can observe, also that the piercing of the price below the -1 Bollinger line is the start of a new impulsive leg down. This would happen on the opposite side of the bands during uptrends.
Join us
Take your trading to the next level with our 14 Day, No Obligation, Free Trial. You will soon discover why we are trading’s best-kept secret. We are successfully building the world’s largest group of profitable traders and would like you to be part of it.
You can join for as little as $19.99 per month, no contract, cancel anytime. Just one profitable trade each month covers this amount, the rest is pure profit. You will benefit from unparalleled access to our professional traders, our transparent trading performance, our LiveTradeRooms and access to the most comprehensive trading education on the market. What have you got to lose? JUST CLICK HERE TO GET STARTED NOW and see how real money is made!

Featured image courtesy of https://pxhere.com