
Double Tops
A double top is the specular image of a double bottom. Price was on an uptrend and made a new local top. Then it pulled back to a local support level, and, after, it rallied again but failed to break the recent top and fell down, breaking down that local support to make fresh lows.
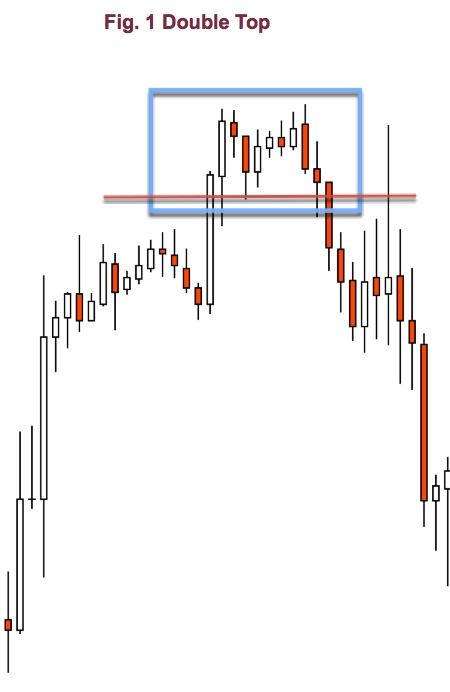
Price trend: upward.
Top Shape: both highs are at the same level or close to it.
Confirmation: The double top is confirmed when the support level is broken down.
How to trade it: Sell the breakdown.
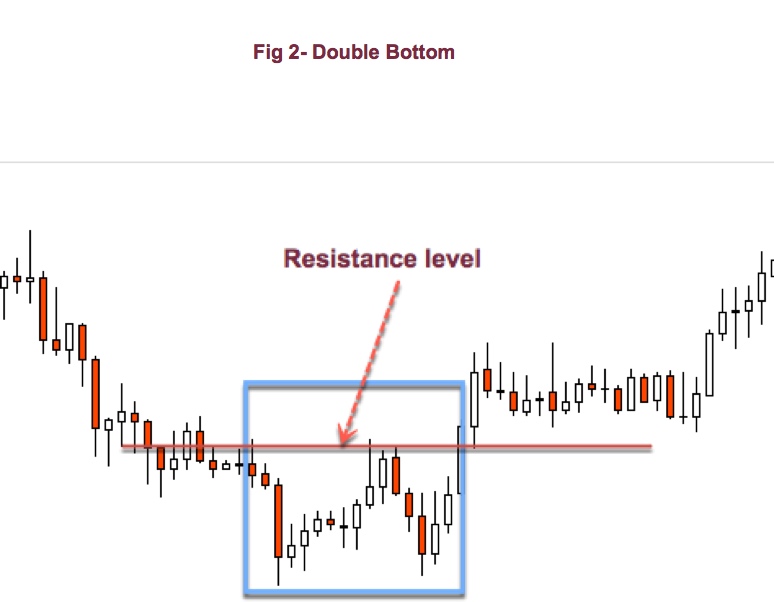
Double Bottoms
A double bottom is the first confirmation that the trend has stopped making new lower lows and lower highs. After a new low is made, the following bars become a small rally to the recent highs.
Then, the price experiences a pull-down from that resistance level, to test the recent lows: The test resolves to the upside, breaking the recent resistance up to fresh highs, starting an upward trend.
Identification:
Price Trend: downward.
Bottom shape: Both bottoms are at the same level or close to it. The shadow of the second low may be below the first low, but it closes above it or the next candle does it.
Confirmation: The double bottom is confirmed by a breakout of the resistance level of the formation.
How to trade it: Buy the breakout.
Triple Tops:
A Triple top is good trend continuation signal on a bear trend, after a pullback rally.
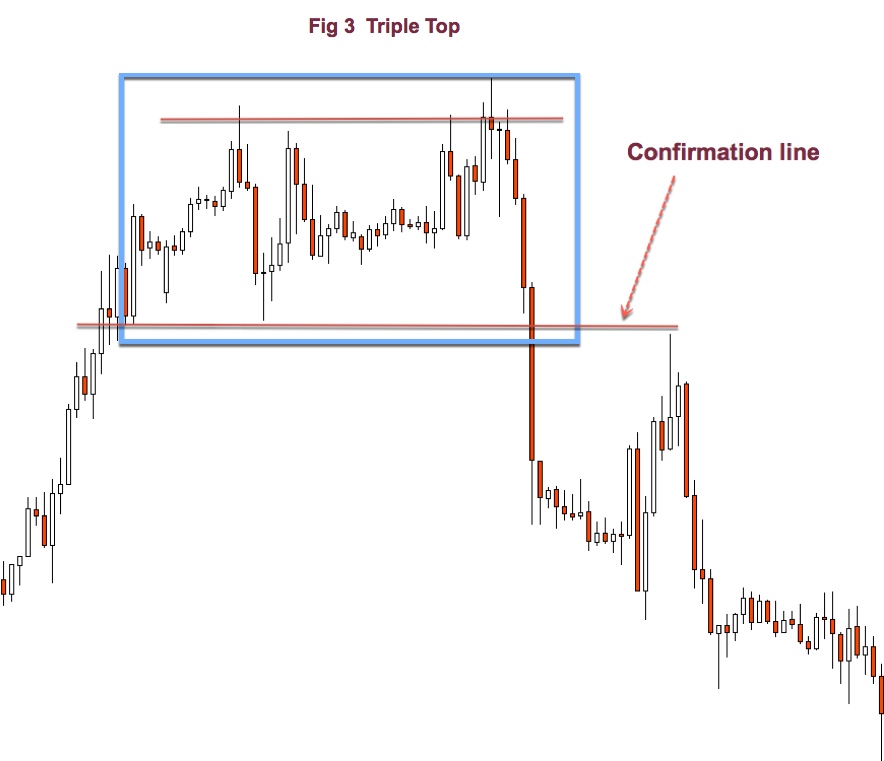
Appearance: Three distinct high well separated. The peaks present sharp spikes.
Tops: The price variation between peaks is minor.
Confirmation: Prices must go below the lowest low in the formation.
How to trade: The breakdown risk is too high. Wait for a pullback to trade.
Triple Bottoms
Triple bottoms are a form of oscillation. Not only present themselves after a long downtrend, but it’s usual to observe three or more bottoms in sideways channels, or in reactive legs during an uptrend.
They are more reliable as a continuation pattern, on a bull trend, than as counter-trend signal in bear markets.
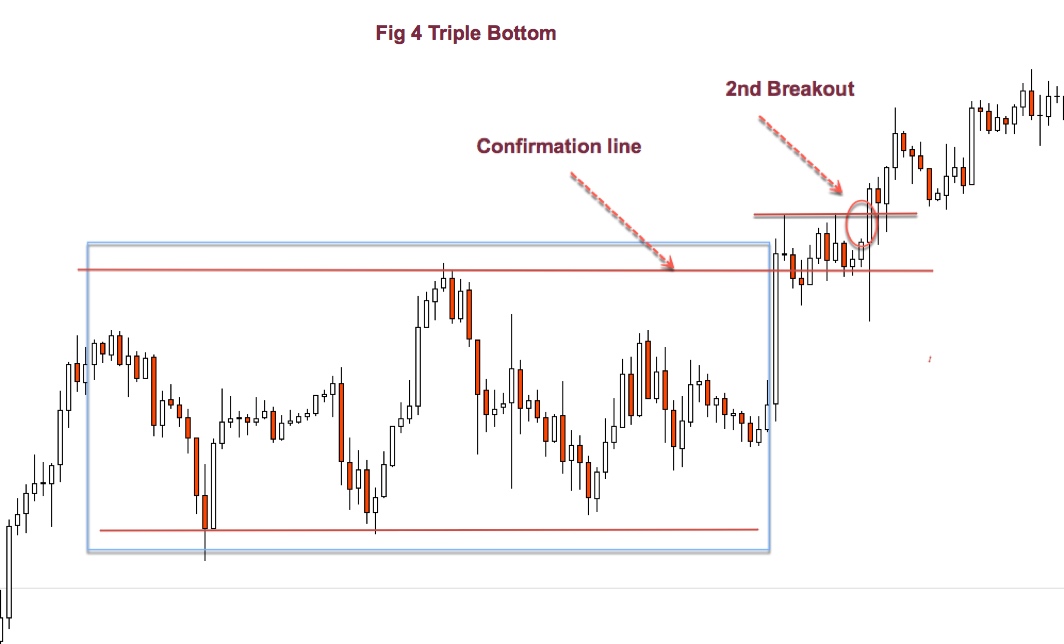
Price trend: Preferably upward
Bottoms: Three bottoms at similar levels. It helps that the second and third bottoms didn’t touch the first one.
Confirmation: Price breaks up the confirmation line.
How to trade: Wait for a pullback to support (confirmation line) and buy the second breakout.
Join us
Take your trading to the next level with our 14 Day, No Obligation, Free Trial. You will soon discover why we are trading’s best-kept secret. We are successfully building the world’s largest group of profitable traders and would like you to be part of it.
You can join for as little as $19.99 per month, no contract, cancel anytime. Just one profitable trade each month covers this amount, the rest is pure profit. You will benefit from unparalleled access to our professional traders, our transparent trading performance, our LiveTradeRooms and access to the most comprehensive trading education on the market. What have you got to lose? JUST CLICK HERE TO GET STARTED NOW and see how real money is made!

Featured image by Adrian courtesy of https://unsplash.com