
This Chart Patterns – Continuation patterns will be dedicated to classical continuation patterns
Flags
A typical continuation pattern. After an impulsive leg a pause in the opposite direction. It’s usually a nice entry point after an impulsive leg.

Appearance: Flags are fast oscillating symmetrical patterns with a downward slope in bull trends and upward one in downtrends. A typical corrective leg.
Volume: Volume fades, receding with the trend.
Confirmation: Breakout, during uptrends, or breakdown on downtrends.
How to trade it: Enter at the breakout, following the previous trend. Do not enter if it’s in opposite direction to the trend, such as, in fig.14, the 4thascending flag.
Pennants
Pennants are a flag variation, but with its trend lines converging.
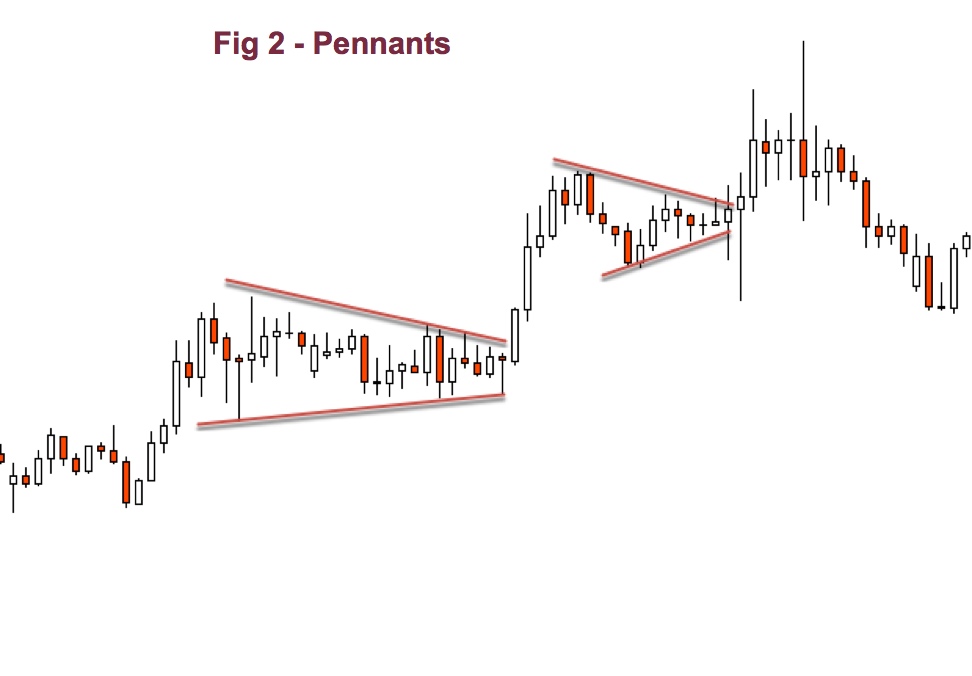
The fact that the volatility fades on a pennant, makes it an excellent spot for good reward to risk trades.
Appearance: Flags are fast oscillating converging patterns. The slope usually is contrary to the main trend, but it may be horizontal or in the same direction to the main trend.
Volume: Volume fades, receding with the trend.
Confirmation: Breakout, during uptrends, or breakdown on downtrends.
How to trade it: Enter at the breakout, following the previous trend.
Triangles and Wedges:
Triangles and Wedges are like flags and pennants. The difference is the undulations are more noticeable and wide, so they take longer to develop. The difference between triangles and Wedges is a bit arbitrary: Triangles have lower highs and higher lows. Wedges may not because their tilt is higher, upward or downward.
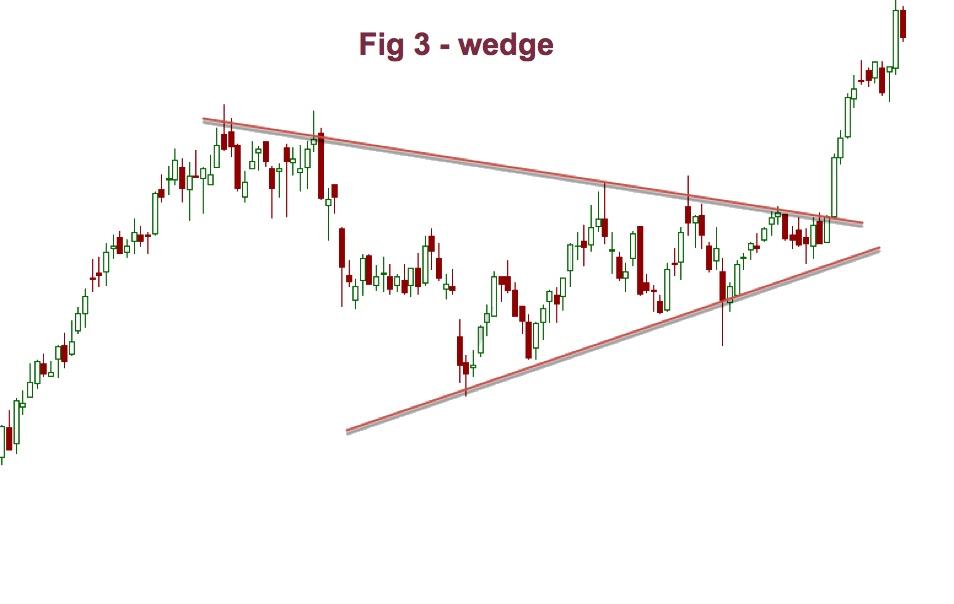
They are reactive waves that, usually, end with the burst of another impulsive wave in the same direction as the previous one. Anyhow beware: All reactive waves, including wedges, are fights between bulls and bears, so its ending is uncertain.
There are upward and downward wedges. The fact that it usually breaks out in the opposite direction of its own is its reactive nature that opposes the main trend.
Appearance: Undulations with fading strength. Its upper and lower trend lines converge
Volume: Volume fades, receding with time.
Confirmation: Breakout, during uptrends, or breakdown on downtrends.
How to trade it: Enter at the breakout, following the previous trend.
Summary
This covers all important chart patterns and formations available.
Their main common feature is they end up on a breakout. To trade them we must evaluate carefully the reward to risk situation and, if not satisfactory, wait for the end of the first impulse and enter at the end of a continuation pattern – usually a flag or pennant.
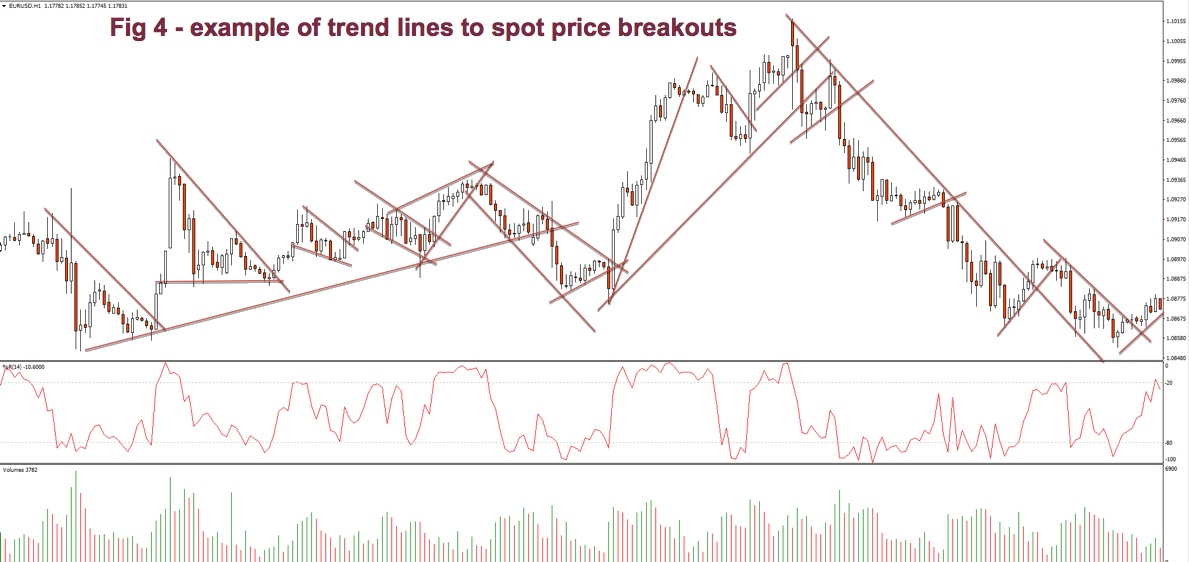
There are plenty of variations of these patterns, and, sometimes, they’re very hard to spot. But if we keep our trendlines touching the local tops or highs on downward legs, and at the local lows during uptrends, we’ll be able to spot trend breakouts, judge where we are, and if it’s a good risk to reward, take appropriate actions. See fig 4.
Join us
Take your trading to the next level with our 14 Day, No Obligation, Free Trial. You will soon discover why we are trading’s best-kept secret. We are successfully building the world’s largest group of profitable traders and would like you to be part of it.
You can join for as little as $19.99 per month, no contract, cancel anytime. Just one profitable trade each month covers this amount, the rest is pure profit. You will benefit from unparalleled access to our professional traders, our transparent trading performance, our LiveTradeRooms and access to the most comprehensive trading education on the market. What have you got to lose? JUST CLICK HERE TO GET STARTED NOW and see how real money is made!

Featured image by Liam Desic, courtesy of https://unsplash.com