
Head-and-Shoulders
It’s a top formation. The inverted Head-and-Shoulders is its specular counterpart as a bottom formation.
Stages of a Head-and-Shoulders pattern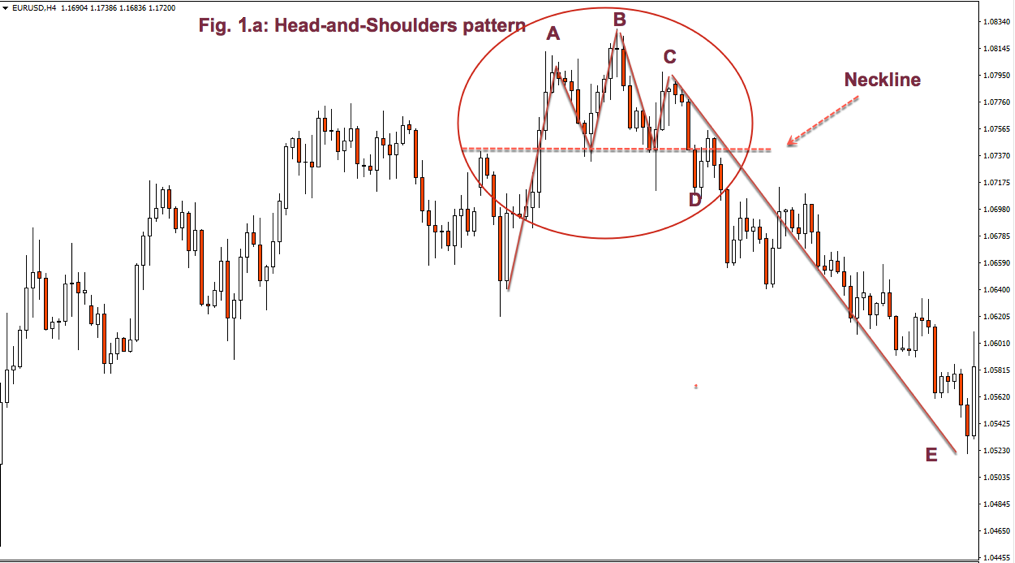
- A strong rally followed by a minor pullback forms the left shoulder.
- Another high-volume rally reaches a higher high and, then, pulls back to or near to the previous low
- A third rally that doesn’t make new highs with a downward leg that push prices below those two previous lows, to D
- Prices are below the neckline that acts as resistance. Prices go up a bit, touching the neckline but failing to hold and descending to fresh lows.
Breakout: The confirmatory stage is D, with prices below the neckline failing to go back up.
The importance of the volume:
The majority of the volume appears during A and B legs, the highest occurring during B rally, and greatly diminished volume during the formation of the right shoulder.

Fig.4.b shows an inverted head-and-shoulders bottom, where the neckline isn’t horizontal, and a typical volume pattern of stronger trading before B and lightening after it.
Join us
Take your trading to the next level with our 14 Day, No Obligation, Free Trial. You will soon discover why we are trading’s best-kept secret. We are successfully building the world’s largest group of profitable traders and would like you to be part of it.
You can join for as little as $19.99 per month, no contract, cancel anytime. Just one profitable trade each month covers this amount, the rest is pure profit. You will benefit from unparalleled access to our professional traders, our transparent trading performance, our LiveTradeRooms and access to the most comprehensive trading education on the market. What have you got to lose? JUST CLICK HERE TO GET STARTED NOW and see how real money is made!

Featured image by Andreas Fidler courtesy of https://unsplash.com