In this article, we are going to discuss the Power Of Compounding.
Causes of Failure
Novice traders enter the Forex markets with the hope to become independent and wealthy. And they may be right. So why 95% of traders fail?
The three main causes:
1.- No trading plan
2.- Psychological weaknesses and biases
3.- Too high position sizing
Their become-rich-quick mentality drives them to trade big at the wrong time. Later, their fear and greed make the rest.
Therefore, my first recommendation for a new trader is to examine his strength to withstand the psychological pressure to break the system. That can be better accomplished risking small amounts. A good advice, then, for their first two years trading would be to use this time to learn and exercise the needed discipline to respect the trading rules.
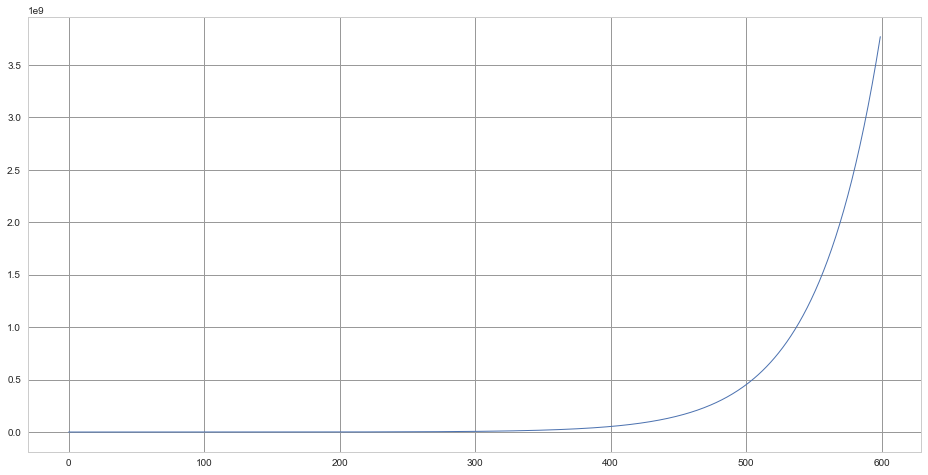
1% nominal annual rate
To help take out your anxiety for an early buck gain, let’s analyse the power of compounding.
Let’s first see, graphically a 10,000 € account grow at a monthly rate of 0,083%, a nominal annual rate of 1% for 50 years (600 months):
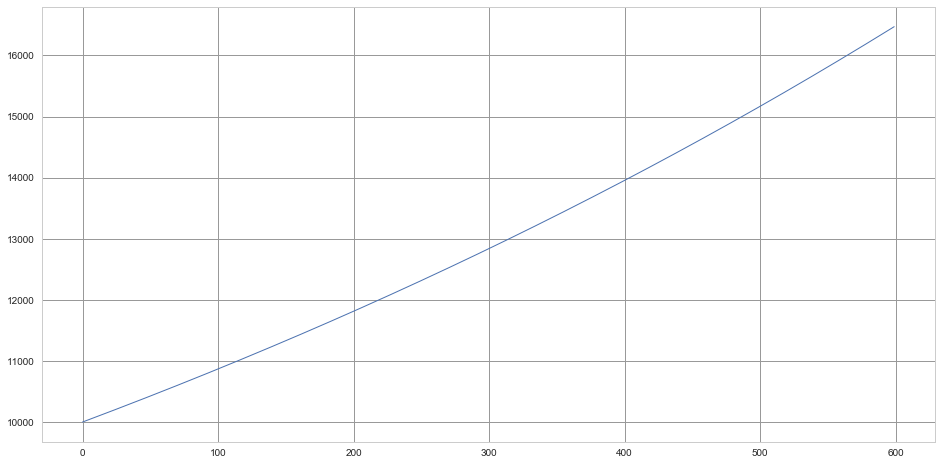
Well, we observe that this state of affairs is only good for the bankers. It takes 50 years to grow 10K into 16,500K. That’s the reason we are willing to risk in trading.
10% nominal annual rate
Let suppose we get a risk-free 10% yearly return instead. Again, with monthly payments of 10%/12:
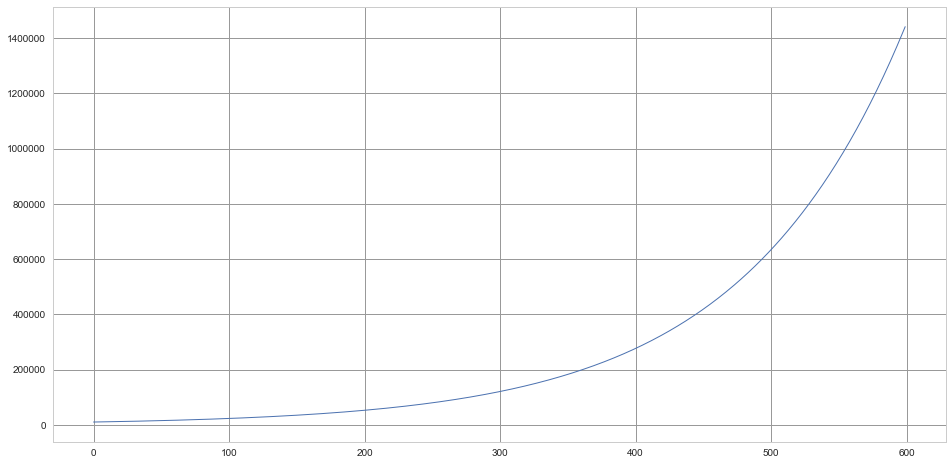
That is becoming interesting. This time, we need to patiently wait for 50 years to become millionaires. In reality, we don’t know how much of that will be erased by inflation, but, it may be a solution for faint-hearted persons.
Berkshire Hathaway returns
Let’s suppose we are investing a la Warren Buffett with average 26% annual returns, with steadily grows on a monthly basis. In this case, the graph is presented in semi-log scale for obvious reasons:
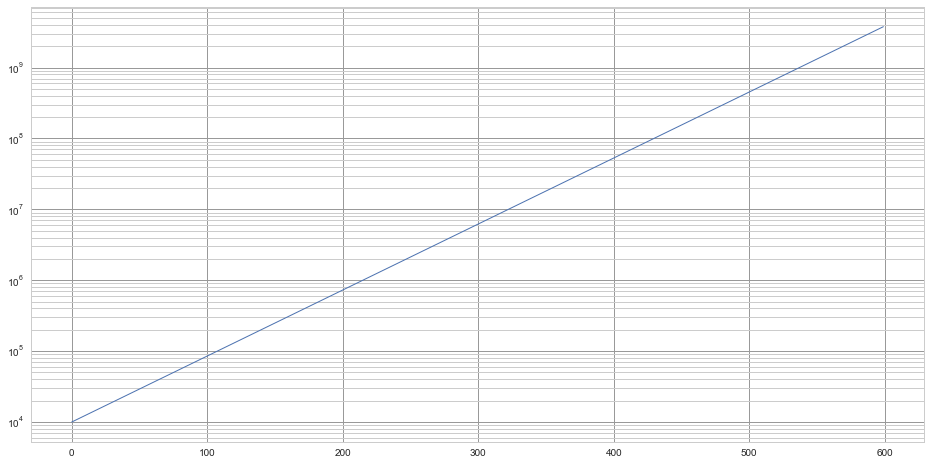
Now, that is another history!
We see that in much less than 50 years we would be as filthily rich as Warren Buffett et al. We observe, also, that we would add one zero to our account roughly once every 100 months. Not Bad! This growth rate multiplies our stake by ten every two years!
And is achieved with a mean 2.17% monthly rate of return on our capital, which means it needs just need a 0.11% daily returnb to make it.
The problem is within us:
This chart shows the same equity curve as the previous image but using a linear scale. What we may observe on it is the equity growth draws an exponential line. There resides our psychological problem: The net equity grows relatively slow at the beginning. It needs four years to reach six zeros, but in another four years, it will be close to an eight-figure account.
This shows that the power of compounding is a long-distance race, not a sprint.
The dark side of growth
Things are not that perfect in trading. We don’t see nice curves up to richness. We should expect not only nice runups but, also harsh drawdowns.
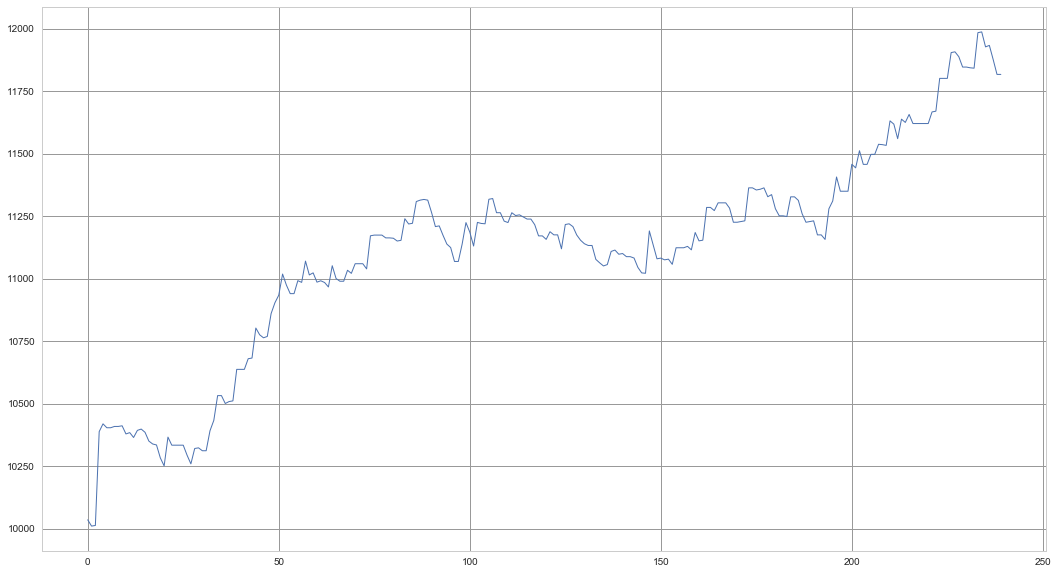
The system model
Let’s observe a typical equity curve of a typical system using a nominal risk of 0.5% on each trade, which, for simplicity, does one trade per day, or 20 per month. And let’s put a magnifying glass on the first year of its history.
     Starting Capital:  10,000
  Mean ending Capital:  11,817
       Capital % gain:  18.17%
         Max drawdown:  2.64%
This is a real, although not brilliant, system with the following basic statistics:
STRATEGY STATISTICS:

              Nr. of trades: 143.00
                    gainers: 58.74%
              Profit Factor: 1.74
                   mean nxR: 1.22 ( the mean reward-to-risk ratio)


 sample stats parameters:
          mean(Expectancy): 0.3070
              Standard dev: 1.9994
           VAN K THARP SQN: 1.5353
The mean monthly profit, using a 0.5% risk is 3%, which results in an annual growth close to 39%. A bit better than what Warren Buffet has been performing.
Its nice feature is that with a 0.5% risk its max drawdown is 5.25%
Now, using exactly the same trade unitary gains, we are going to steadily increase the position size, and therefore, the risk per trade. Let’s see how fares this system:
2% Risk:
Starting Capital: 10,000
Mean ending Capital:   18,910
       Capital % gain:   89.10%
Max drawdown:   10.38%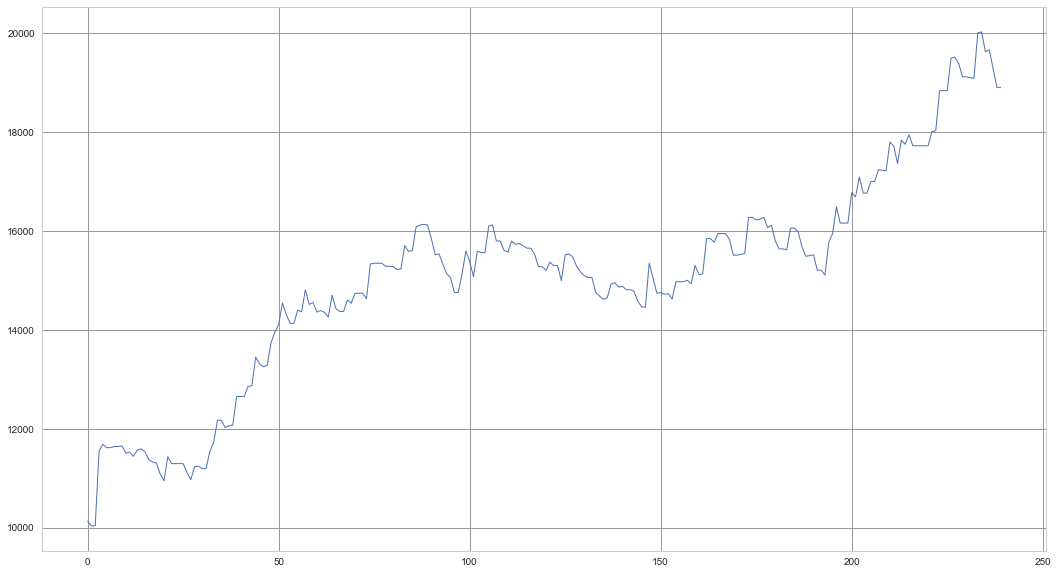
5% risk:
Starting Capital:  10,000
  Mean ending Capital:  42,615
          Capital % gain:  326.15%
  Max drawdown:  25.39%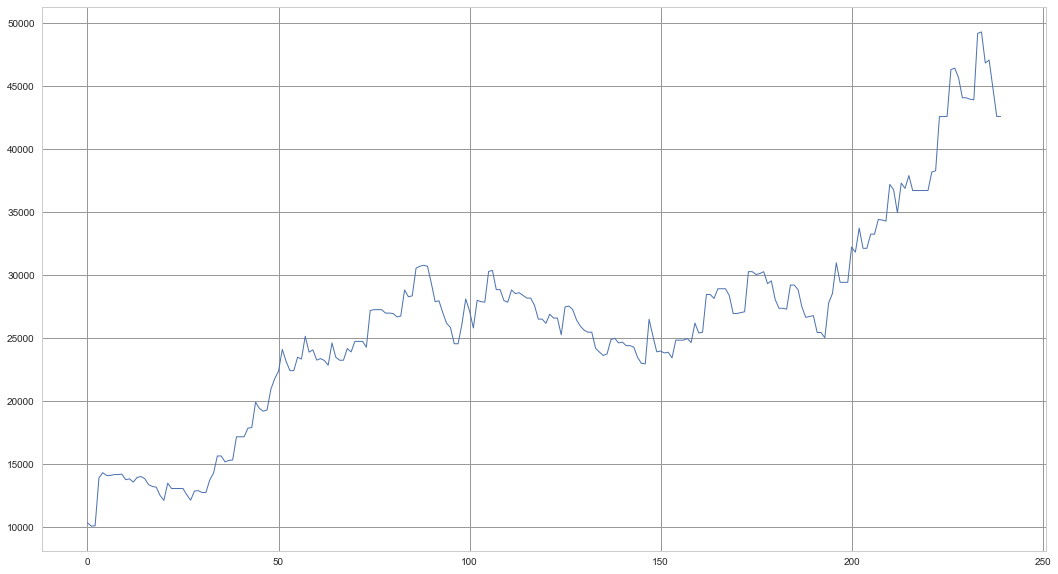
10% Risk:
Starting Capital:  10,000
   Mean ending Capital:  118,032
            Capital % gain:  1,080.32%
  Max drawdown:  47.67%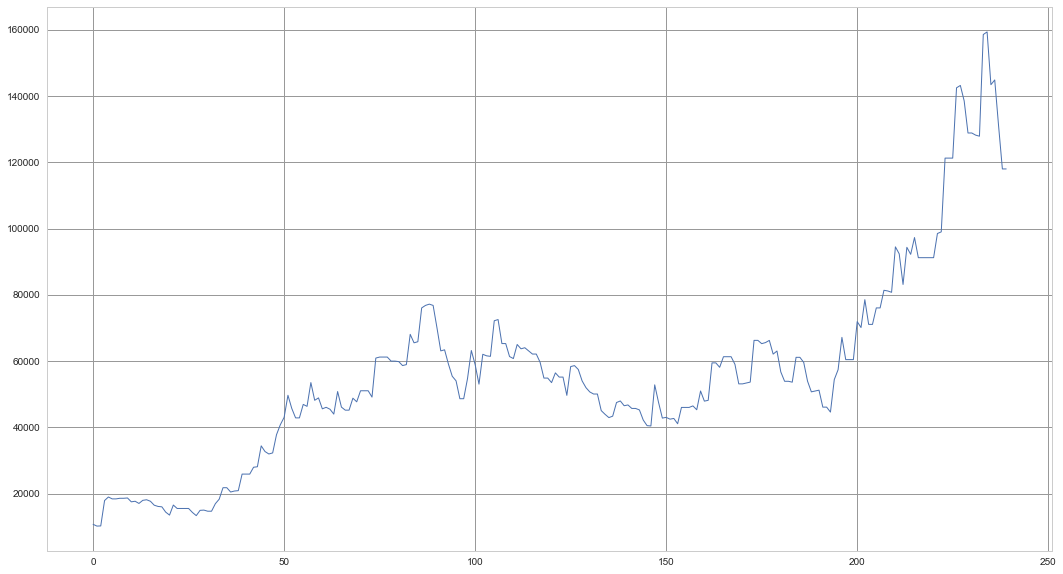
20% Risk:
Starting Capital:  10,000
  Mean ending Capital:  308,888
            Capital % gain:  2,988.88%
  Max drawdown:  79.99%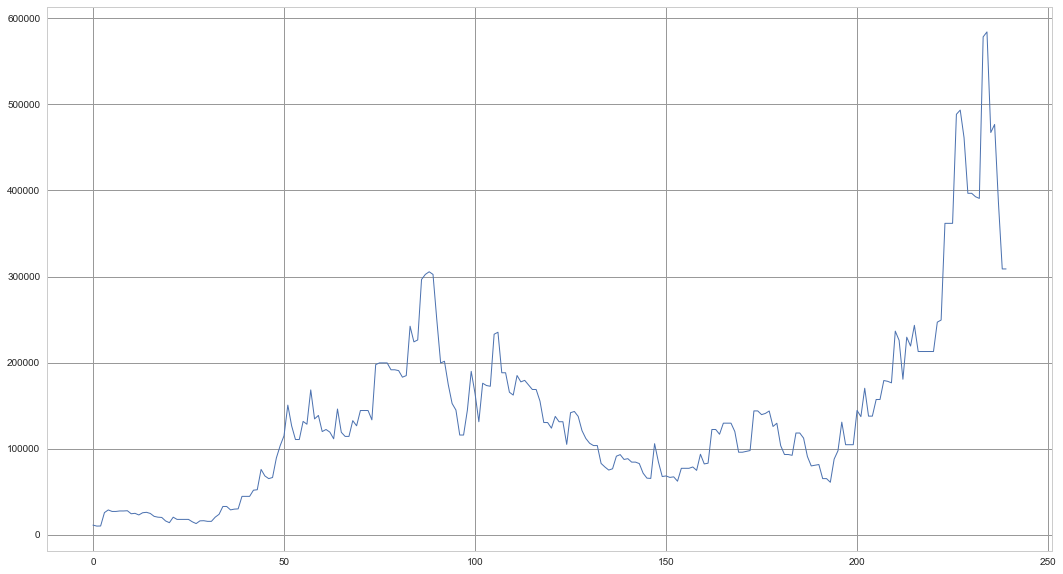
25% Risk:
  Starting Capital:  10,000
Mean ending Capital:  308,771
       Capital % gain:  2,987.71%
      Max drawdown:  90.19%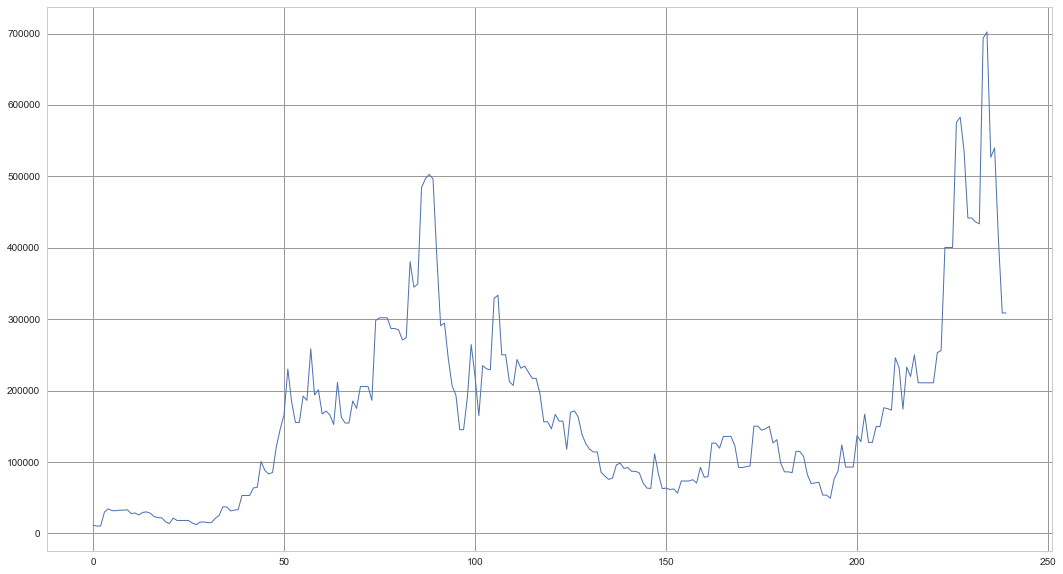
35% Risk:
  Starting Capital:  10,000
Mean ending Capital:  124,613
       Capital % gain:  1,146.13%
      Max drawdown:  96.83%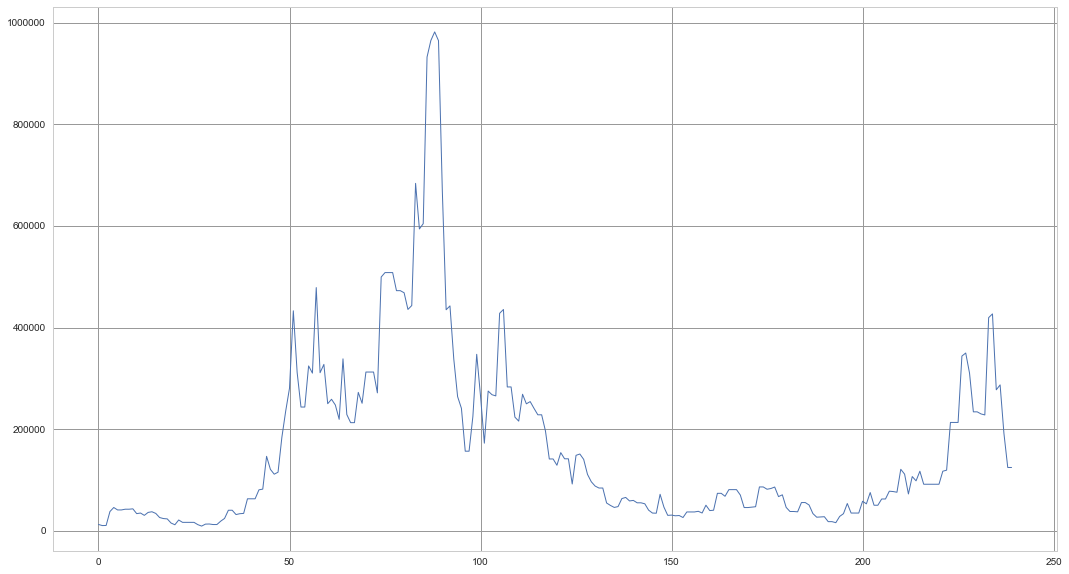
45% Risk:
   Starting Capital:  10,000
Mean ending Capital:  14,725
     Capital % gain:  47.25%
       Max drawdown:  99.53%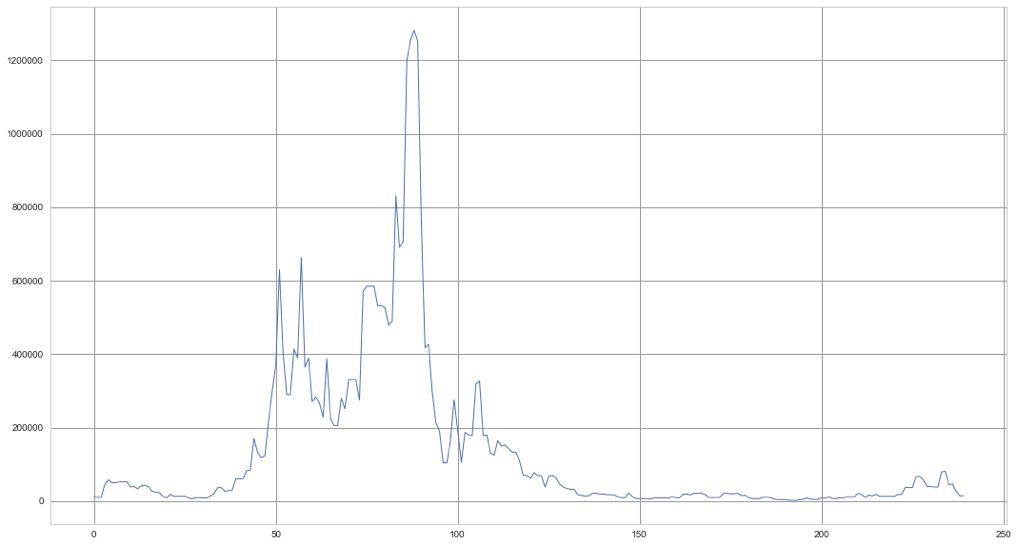
What have we learned?
-
- Max drawdown is related to position size. The bigger its size, the larger the drawdown.
- As position size grows, up to a certain limit, capital gain grows geometrically, but drawdowns grow also, although arithmetically.
- After a certain limit of risk is exceeded not only drawdown grows, but returns diminish.
- The ideal position size depends not only on the quality and statistical characteristics of a trading system but also on the type of trader you are. There are traders willing to accept up to 40% drawdowns. Those traders may risk up to 10% of their trading capital in one single trade. Less risk-seeker traders may be willing to accept no more than 20%. Depending on the system, 4-5% is their limit.
- My advice to new traders is to limit themselves to no more than 0.5% at least during the learning stage, or 1-2 years. During that time they should collect information about their performance and regularly compute the statistical properties of their system.
How to plan for the drawdown
- A simple approach to compute the preferred risk per position is to be prepared for a 10-20 consecutive losing streak. Let’s suppose we want a drawdown limited to no more than 20%. If the statistics of the system show that our per cent winners are considerably below 50%, then we should protect ourselves against at least 20 losers in a row. If our per cent winners are above 50% and our mean reward-to-risk ratio is above 1, then we may settle for 10 or 15 losers in a row.
- The method to limit the risk is simple. We divide the drawdown amount by the losing streak number. If you wanted to protect yourself against 20 losers in a row and your maximum desired drawdown is set to 20% then: 20%/20. So, it means that you cannot risk more than 1% on each trade.
- In case you wanted just a 15-loser streak protection, your max risk may rise up to 1.33%, and up to 2% in the case of a 10-loser streak figure. Therefore, If you initially trade using 0.5% risk on your account, you make sure that your maximum drawdown is 50% less. Therefore, it’s highly improbable that this drawdown moves above 10% of the current balance.
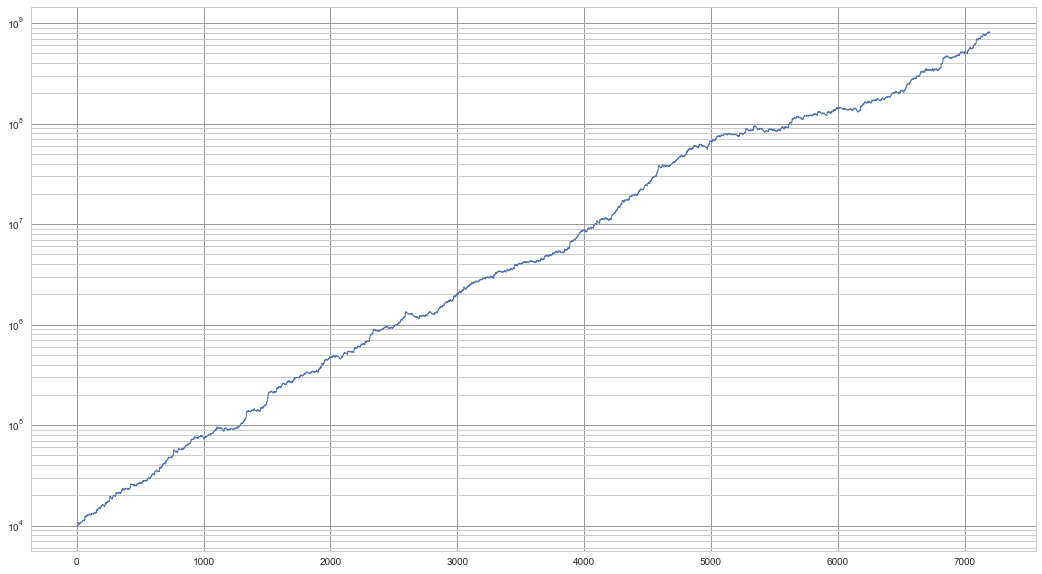
The rabbit and the turtle
- Below we show a possible 30-year log-plot history of this sample system using 0.5% risk. We can observe that if the system continues performing well along the way, the trader’s wealth will grow well beyond its wildest dreams, without the need to risk a disproportionate percentage of his capital.
- Sometimes, the turtle wins to the rabbit, because a too fast rabbit may get hit by a bullet.
Take your trading to the next level with our 14 Day, No Obligation, Free Trial. You will soon discover why we are trading’s best-kept secret. We are successfully building the world’s largest group of profitable traders and would like you to be part of it.
You can join for as little as $19.99 per month, no contract, cancel anytime. Just one profitable trade month covers this amount, the rest is pure profit. You will benefit from unparalleled access to our professional traders, our transparent trading performance, our LiveTradeRooms and access to the most comprehensive trading education on the market. What have you got to lose? JUST CLICK HERE TO GET STARTED NOW and see how real money is made!
